Pie Chart - Common
목적
PieChart(원형 차트)는
데이터를 원형 형태로 시각화하여 구성 비율을 한눈에 파악할 수 있는 그래프
기본 형태 및 도넛 형태의 차트를 구성하는 UI 설명
주요 단계
1. UI 생성 - PieChart
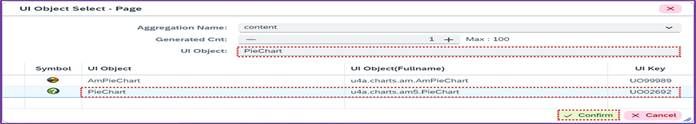
<사진 1> PieChart UI
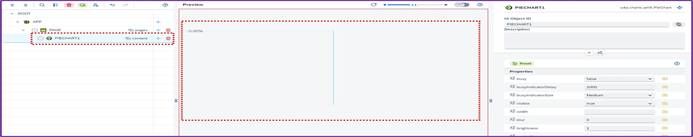
<사진 2> PieChart UI 적용된 미리보기 화면
1.1. 주요 Properties
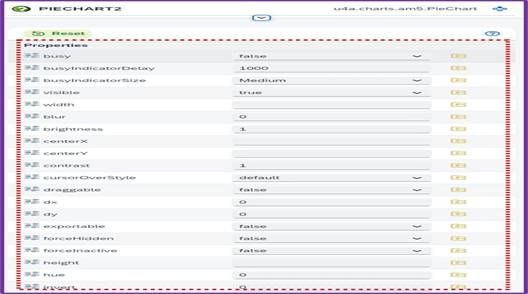
<사진 3> PieChart UI Properties
| Names | Description |
|---|---|
| visible | 차트 표시 유무 |
| width | 차트 구성 영역 너비 |
| height | 차트 구성 영역 높이 |
1.2. 주요 Aggregation
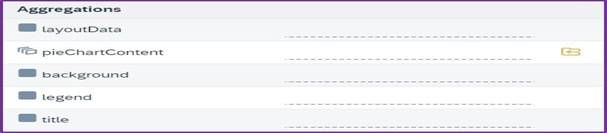
<사진 4> PieChart UI Aggregation
| Names | Description |
|---|---|
| pieChartContent | PieChart 내부에서 데이터를 표시하는 주요 구성 요소 |
| background | 차트 배경 설정(색상 등) |
| legend | 범례 생성 여부 (Legend 문서 참조 - Detail) |
| title | 차트 제목 생성 (Title 문서 참조 - Detail) |
2. UI 생성 - PieChartContent
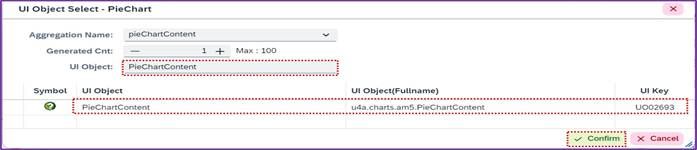
<사진 5> PieChartContent UI
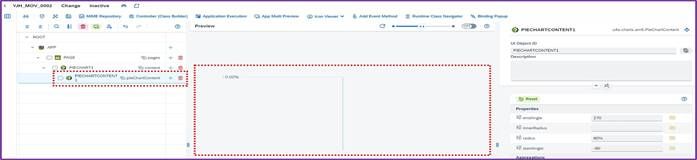
<사진 6> PieChartContent UI 적용된 미리보기 화면
2.1. PieChartContent 주요 Properties
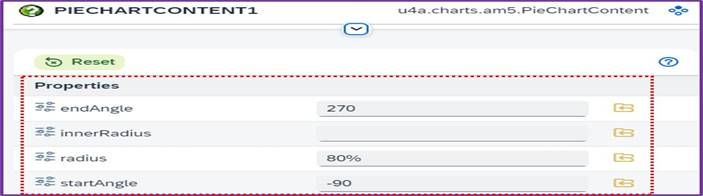
<사진 7> PieChartContent Properties
| Names | Description |
|---|---|
| endAngle | PieChart의 끝나는 각도 |
| innerRadius | 내부 반지름 설정 |
| radius | PieChart 영역 크기 |
| startAngle | PieChart의 시작 각도 |
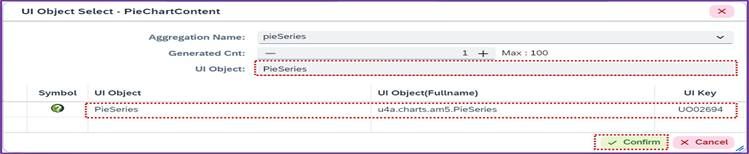
2.2 PieChartContent 주요 Aggregation

<사진 8> PieChartContent Aggregation
| Names | Description |
|---|---|
| pieSeries | PieChartContent 내부에서 데이터를 실제로 표현하는 부분 |
3. UI 생성 - PieSeries
<사진 9> PieSeries UI
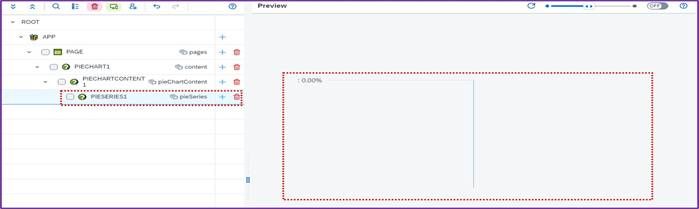
<사진 10> PieSeries UI 미리보기 적용 화면
3.1. PieSeries 주요 Properties
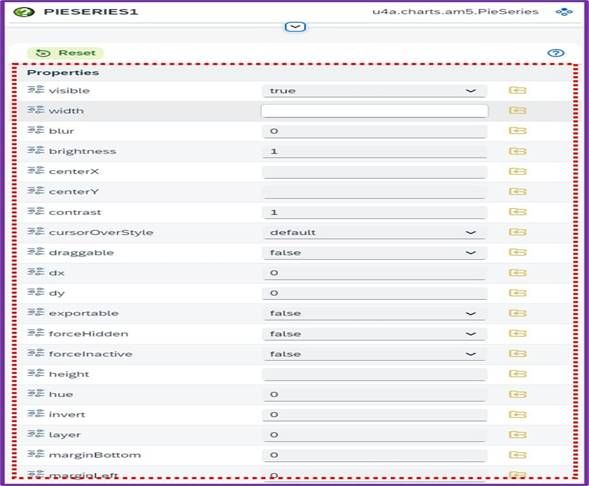
<사진 11> PieSeries UI Properties
| Names | Description |
|---|---|
| value | 데이터 값 |
| categoryText | Category 명칭 |
| legendLabelText | 범례 라벨 텍스트 |
| fill | Pieseries 차트 색상 |
| cornerRadius | 모서리 둥글기 |
3.2 PieSeries 주요 Events
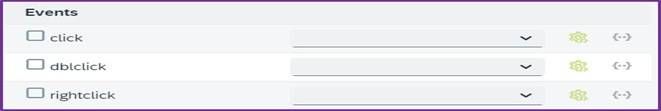
<사진 12> PieSeries UI Events
| Names | Description |
|---|---|
| click | 클릭 이벤트 |
| dbclick | 더블 클릭 이벤트 |
| rightclick | 우클릭 이벤트 |
3.3. PieSeries 주요 Aggregations
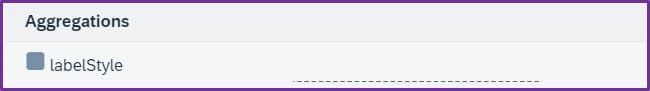
<사진 13> PieSeries UI Aggregations
| Names | Description |
|---|---|
| labelStyle | PieSeries Label Style 설정 |
4. PieChart 적용하기
o PieChart의 실제 예제를 통한 단계적 적용 방법은 "Pie Chart - Standard", "Pie Chart -
SingleDonut" 문서에서 안내
4.1. Pie Chart - Standard : Detail

<사진 14> PieChart 기본 형태 이미지
4.2. Pie Chart - SingleDonut : Detail
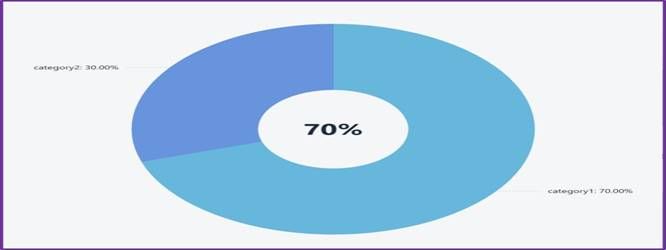
<사진 15> PieChart Donut 형태 이미지
추가 정보
o UI의 추가적인
Properties 정보는 UI Properties의 각
Property 명칭을 클릭하면 상세 설명을 확인할 수 있음