Legend
목적
XY Chart, Radar Chart, Pie Chart에서 Legend를 추가하고, UI 속성을 설정하는 방법을 설명
주요 단계
1. Legend 추가하기
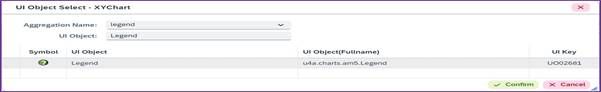
<사진 1> Legend UI 추가 화면
2. Legend Label 설정 방법
2.1. XY Chart
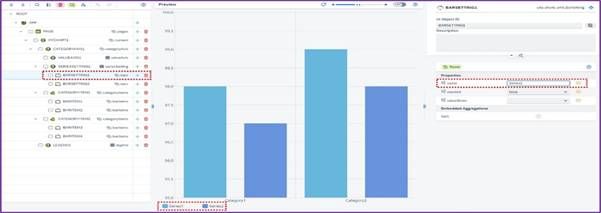
<사진 2> XY Chart Legend 적용 화면
o XY Bar Chart Legend Label 기준 : BarSetting - Name
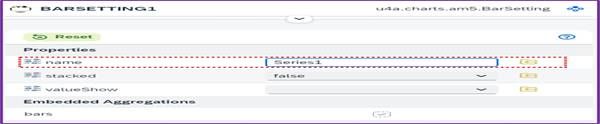
<사진 3> XY Chart BarSetting Name 입력 화면
o XY Line Chart Legend Label 기준 : LineSetting - Name
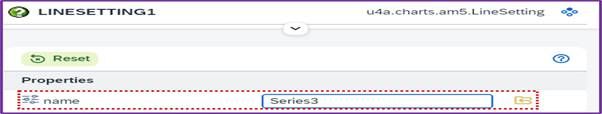
<사진 4> XY Chart LineSetting Name 입력 화면
2.2. Radar Chart
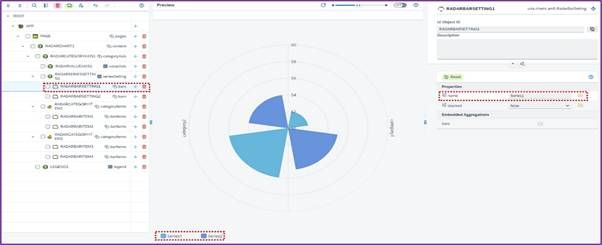
<사진 5> Radar Chart Legend 적용 화면
o Radar Bar Chart Legend Label 기준 : BarSetting - Name
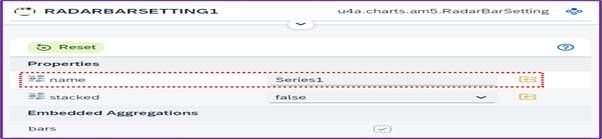
<사진 6> Radar Chart BarSetting Name 입력 화면
o Radar Line 차트 Legend Label 기준 : LineSetting - Name
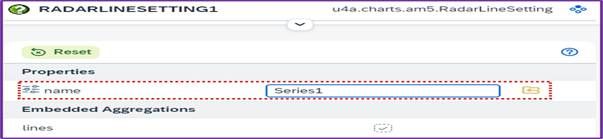
<사진 7> Radar Chart LineSetting Name 입력 화면
2.3. Pie Chart
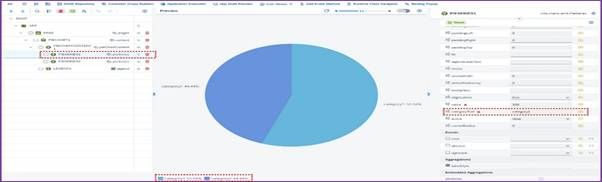
<사진 8> Pie Chart Legend 적용 화면
o Pie Chart Legend Label 기준 : PieSeries - categoryText
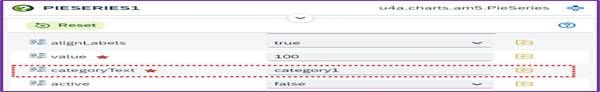
<사진 9> Pie Chart PieSeries categoryText 입력 화면
3. Legend UI 속성 및 Aggregation
3.1. 주요 Properties
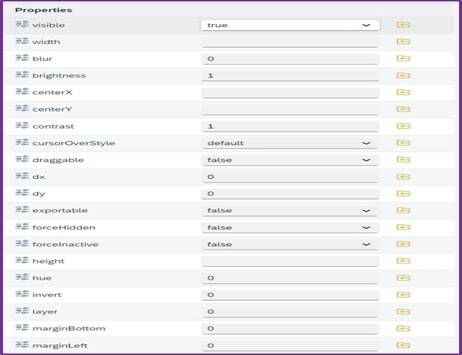
<사진 10> Legend Properties
| Name | Description |
|---|---|
| visible | Legend 표시 여부 설정 |
| width | Legend의 너비 설정 |
| forceInactive | Legend 비활성화 설정 |
| centerX | 중심 X 좌표 설정 (width 기준 x축 중심 좌우 위치 설정) |
| x | X 좌표 설정 (width 기준 x축 좌우 위치 설정) |
| tooltipText | Legend 툴팁 텍스트 설정 |
3.2. 주요 Aggregations

<사진 11> Legend Aggregations
| Name | Description |
|---|---|
| labelStyle | Legend Label 스타일 설정 |
| markerStyle | Legend Marker 스타일 설정 |
4. labelStyle
4.1. 주요 Properties
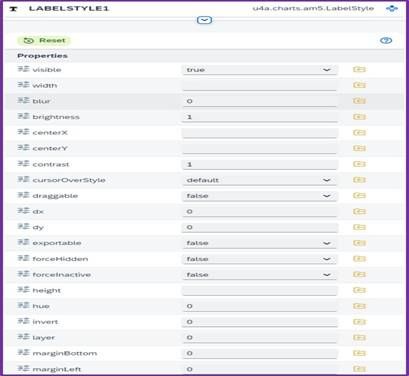
<사진 12> LabelStyle Properties
| Name | Description |
|---|---|
| visible | Label 표시 여부 설정 |
| fill | Label 색상 설정 |
| fontSize | Label 글자 크기 설정 |
| fontWeight | Label 글자 두께 설정 |
5. markerStyle
5.1. 주요 Properties
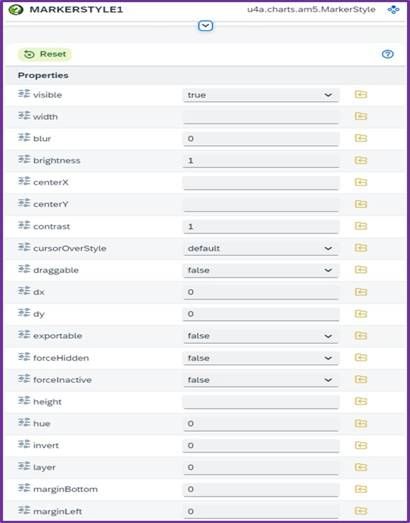
<사진 13> MarkerStyle Properties
| Name | Description |
|---|---|
| rotation | Marker 회전 설정 |
| scale | Marker 크기 조절 |